Imports#
import pandas as pd
import numpy as np
import matplotlib.pyplot as plt
%matplotlib inline
Data#
from sklearn.datasets import load_iris
iris = load_iris(as_frame=True)
df = iris.data
df["target"] = iris.target
df.head()
| sepal length (cm) | sepal width (cm) | petal length (cm) | petal width (cm) | target | |
|---|---|---|---|---|---|
| 0 | 5.1 | 3.5 | 1.4 | 0.2 | 0 |
| 1 | 4.9 | 3.0 | 1.4 | 0.2 | 0 |
| 2 | 4.7 | 3.2 | 1.3 | 0.2 | 0 |
| 3 | 4.6 | 3.1 | 1.5 | 0.2 | 0 |
| 4 | 5.0 | 3.6 | 1.4 | 0.2 | 0 |
df.tail(10)
| sepal length (cm) | sepal width (cm) | petal length (cm) | petal width (cm) | target | |
|---|---|---|---|---|---|
| 140 | 6.7 | 3.1 | 5.6 | 2.4 | 2 |
| 141 | 6.9 | 3.1 | 5.1 | 2.3 | 2 |
| 142 | 5.8 | 2.7 | 5.1 | 1.9 | 2 |
| 143 | 6.8 | 3.2 | 5.9 | 2.3 | 2 |
| 144 | 6.7 | 3.3 | 5.7 | 2.5 | 2 |
| 145 | 6.7 | 3.0 | 5.2 | 2.3 | 2 |
| 146 | 6.3 | 2.5 | 5.0 | 1.9 | 2 |
| 147 | 6.5 | 3.0 | 5.2 | 2.0 | 2 |
| 148 | 6.2 | 3.4 | 5.4 | 2.3 | 2 |
| 149 | 5.9 | 3.0 | 5.1 | 1.8 | 2 |
Train-Test Split#
from sklearn.model_selection import train_test_split
X = df.drop('target', axis=1)
y = df['target']
X_train, X_test, y_train, y_test = train_test_split(X, y, test_size=0.10)
Decision Tree#
from sklearn.tree import DecisionTreeClassifier
dtree = DecisionTreeClassifier(max_depth=2)
dtree.fit(X_train,y_train)
DecisionTreeClassifier(max_depth=2)In a Jupyter environment, please rerun this cell to show the HTML representation or trust the notebook.
On GitHub, the HTML representation is unable to render, please try loading this page with nbviewer.org.
DecisionTreeClassifier(max_depth=2)
Voorspelling en score#
y_pred = dtree.predict(X_test)
from sklearn.metrics import classification_report, confusion_matrix
print(classification_report(y_test, y_pred))
              precision    recall  f1-score   support

           0       1.00      1.00      1.00         5
           1       1.00      0.80      0.89         5
           2       0.83      1.00      0.91         5

    accuracy                           0.93        15
   macro avg       0.94      0.93      0.93        15
weighted avg       0.94      0.93      0.93        15
print(confusion_matrix(y_test, y_pred))
[[5 0 0]
 [0 4 1]
 [0 0 5]]
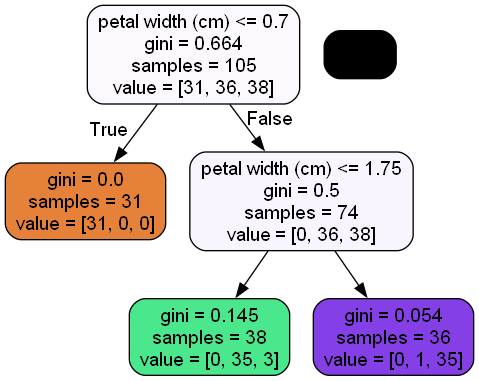
Visualisatie#
from IPython.display import Image
from six import StringIO
from sklearn.tree import export_graphviz
import pydot

features = list(df.columns[0:4])
features
['sepal length (cm)',
 'sepal width (cm)',
 'petal length (cm)',
 'petal width (cm)']
dot_data = StringIO()
export_graphviz(dtree, out_file=dot_data, feature_names=features, filled=True, rounded=True)
graph = pydot.graph_from_dot_data(dot_data.getvalue())
Image(graph[0].create_png())
Random Forest#
from sklearn.ensemble import RandomForestClassifier

rfc = RandomForestClassifier(n_estimators=500, n_jobs=-1)
rfc.fit(X_train, y_train)
RandomForestClassifier(n_estimators=500, n_jobs=-1)In a Jupyter environment, please rerun this cell to show the HTML representation or trust the notebook.
On GitHub, the HTML representation is unable to render, please try loading this page with nbviewer.org.
RandomForestClassifier(n_estimators=500, n_jobs=-1)
rfc_pred = rfc.predict(X_test)
print(confusion_matrix(y_test,rfc_pred))
[[19  0  0]
 [ 0 14  0]
 [ 0  2 10]]
print(classification_report(y_test,rfc_pred))
              precision    recall  f1-score   support

           0       1.00      1.00      1.00        19
           1       0.88      1.00      0.93        14
           2       1.00      0.83      0.91        12

    accuracy                           0.96        45
   macro avg       0.96      0.94      0.95        45
weighted avg       0.96      0.96      0.96        45
for score, name in zip(rfc.feature_importances_, features):
    print(round(score, 2), name)
0.1 sepal length (cm)
0.03 sepal width (cm)
0.43 petal length (cm)
0.44 petal width (cm)